What Edge Acceleration Actually Buys You: Latency, Routing and Cache Hits
A CDN changes two things: the distance your packets travel, and whether they travel at all. Both are measurable, and most dashboards measure neither honestly.

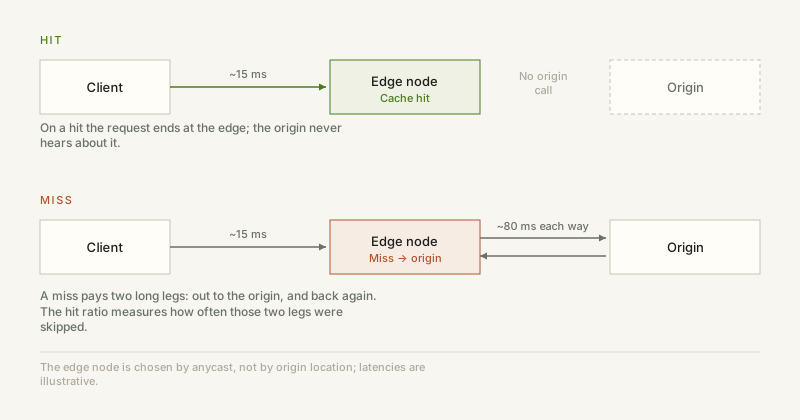
These two halves were written separately but answer the same question from opposite ends: what does a CDN actually change? The first half is distance — which edge node answers you, how long that path is, and when the number is really your own network's fault. The second is necessity — on a hit the request never reaches the origin, on a miss it travels further than a direct connection would. Only together do they tell you whether "global acceleration" is a true statement about your site.
Everyone quotes a ping number, and almost nobody knows what it is measuring. A round-trip time is only meaningful next to the path it took and the moment it was taken.
1. Light does not travel instantly
In fibre, light covers roughly 200 kilometres per millisecond. Tokyo to Frankfurt is about 9,300 km in a straight line, so the physical floor for a round trip is already around 93 ms — before routers, queues and TLS handshakes. Any published number far below that is measuring something else.
2. What the edge node tells you
A CDN answers from the nearest point of presence, not from the origin. That is why the same site can feel instant in one city and sluggish in another: you are measuring the distance to the edge, not to the server that stores the data.
3. What to measure alongside it
- Variance, not just the average. A steady 120 ms feels far better than a jittery 60 ms that spikes to 400.
- Packet loss. Even one percent forces retransmissions and destroys throughput on TCP.
- The first-sample penalty: DNS lookup, TCP handshake and TLS negotiation add round trips before a single byte of content moves.
- Time of day. Congestion is a diurnal pattern, and the same route degrades predictably at peak hours.
4. Running your own check
Take several samples, keep them all, and compare with the access node that answered. If the node is close but latency is high, the bottleneck is the last mile or your local network. If the node is far away, the number is geography, not a fault.
5. When to suspect your own network
If the same edge node varies by a factor of three across one day, the CDN is almost certainly not the problem: evening congestion lives in the access network and the last mile. The test is simple — ping your own gateway and a public target at the same time. If the gateway is also unstable, it is your wireless or router. If the gateway is steady and the public target is not, it is congestion at the carrier edge. That distinction saves an entire pointless support conversation.
One more detail worth noting: the number a browser reports includes DNS resolution, the TCP handshake and TLS negotiation. Time a bare handshake with curl and compare it to the figure on the page — the wider the gap, the more a first visit costs, and the more a preconnect is worth.
A team moves to a CDN, watches the dashboard, sees a 92% hit ratio, and then gets complaints that the site feels slower. Both facts are true, and neither one is the number they think they are looking at.
6. Start with what is actually cacheable
Most CDNs ship with a static-extension rule: images, fonts, CSS and JS get cached, HTML does not. That is why a site can show a healthy global hit ratio while every single page navigation still goes to the origin. Your dashboard is averaging in a million cached favicon requests and a thousand uncached documents.
On Cloudflare the default is exactly this extension-based behaviour, which means HTML responses come back as DYNAMIC unless a Cache Rule says otherwise. The fix is a cache rule scoped to the document route, plus a Cache-Control that says out loud what you want: public, with a short s-maxage and a stale-while-revalidate window.
7. Read the response header before the dashboard
Open devtools, look at the request, find cf-cache-status. HIT means it came from the edge. MISS means it went to the origin and may now be stored. EXPIRED means it was there but stale. REVALIDATED means it was revalidated with the origin. BYPASS means something explicitly skipped the cache — usually a cookie, a rule, or a request method. DYNAMIC means the platform decided this response is not cacheable at all. Four of those six states mean "not a hit", and only one of them is a bug.
8. Four things that silently disable caching
- A Set-Cookie header on a cacheable response. Most CDNs refuse to store a response that sets cookies, because doing so would leak one user's session to another. One analytics cookie in your HTML template is enough.
- Vary: Cookie. Even without setting a cookie, declaring that the response varies by it makes every visitor a distinct cache key.
- A unique URL per visit. Session ids, cache-busting timestamps or every utm parameter left in the path turn one page into thousands of entries that each get one hit.
- Cache-Control: private or no-store, often added by a framework default or by an origin rule that someone wrote during an incident and never removed.
9. A high hit ratio is not the goal
You can reach 99% by caching pages for a day. You will also serve yesterday's prices. The useful question is not "how many requests were served from cache" but "how many requests were served from cache and were still correct". A 70% ratio with a revalidation window that keeps content fresh beats 99% with a manual purge every time someone edits a page.
Measure it per route, not per site. A blog index and a logged-in dashboard live in the same dashboard number and have nothing to do with each other; averaged together they hide both problems. Sample the logs by path template, and look at the worst ten routes rather than the site-wide average.
10. The other half of the latency
A cache hit still costs a round trip to the nearest edge node, and the edge node is chosen by anycast, not by your database. If your origin sits in one region, a cache miss from the other side of the world is two long trips, not one. That is the case where a CDN genuinely helps — and where a correctly cached page stops being an optimisation and becomes the difference between 40 ms and 400 ms.
ipbox.one reports the edge location (colo) that actually answered your request, next to the latency samples, so you can tell whether the number you measured is your last mile or a node on the other side of an ocean.


